Much like the tool you use for unit testing, the tool you use for code coverage depends on the programming language and application framework you use.
When you target .NET Core applications to run on Linux, coverlet is a popular option. Coverlet is a cross-platform, code-coverage library for .NET Core. Before we add code coverage to the pipeline, let’s check in with the team.
How is code coverage done in .NET Core?
The way you collect code coverage depends on what programming language and frameworks you’re using, as well as what code coverage tools are available.
Mara and Andy do some investigation around code coverage for .NET Core applications. Here’s what they find:
- Visual Studio on Windows provides a way to perform code coverage.
- However, because the team is building on Linux, they can use coverlet , a cross-platform code coverage library for .NET Core.The unit test project requires the coverlet.msbuild NuGet package.
- Code coverage results are written to an XML file so that they can be processed by another tool. Azure Pipelines supports Cobertura and JaCoCo coverage result formats.Mara and Andy decide to try Cobertura.
- To convert Cobertura coverage results to a format that’s human-readable, they can use a tool called ReportGenerator .
- ReportGenerator provides a number of formats, including HTML. The HTML formats create detailed reports for each class in a .NET project.Specifically, there’s an HTML format called HtmlInline_AzurePipelines, which provides a visual appearance that matches Azure Pipelines.
How can I manage .NET Core tools?
A .NET Core tool such as ReportGenerator is a special NuGet package that contains a console application. You can manage a .NET Core tool as a global tool or as a local tool.
A global tool is installed in a centralized location and can be called from any directory. One version of a global tool is used for all directories on the machine.
A local tool is a more isolated copy of a .NET Core tool that’s scoped to a specific directory. Scope enables different directories to contain different versions of the same tool.
You use a manifest file to manage local tools for a given directory. This file is in JSON format and is typically named dotnet-tools.json. A manifest file enables you to describe the specific tool versions that you need to build or run your application.
When you include the manifest file in source control along with your application sources, developers and build systems can run the dotnet tool restore command to install all of the tools listed in the manifest file. When you need a newer version of a local tool, you simply update the version in the manifest file.
To keep things more isolated, in this module you work with local tools. You create a tool manifest that includes the ReportGenerator tool. You also modify your build pipeline to install the ReportGenerator tool to convert code coverage results to a human-readable format.
Run code coverage locally
Before Mara and Andy write any pipeline code, they decide to try things manually to verify the process. Follow along with their process:
- In Visual Studio Code, open the integrated terminal.
- Run the following
dotnet newcommand to create a local tool manifest file.
dotnet new tool-manifest
The command creates a file named .config/dotnet-tools.json.
3. Run the following dotnet tool install command to install ReportGenerator:
dotnet tool install dotnet-reportgenerator-globaltool
This command installs the latest version of ReportGenerator and adds an entry to the tool manifest file.
Run the following dotnet add package command to add the coverlet.msbuild package to the Tailspin.SpaceGame.Web.Tests project:
dotnet add Tailspin.SpaceGame.Web.Tests package coverlet.msbuild
- 5. Run the following
dotnet testcommand to run your unit tests and collect code coverage:
dotnet test --no-build \
  --configuration Release \
  /p:CollectCoverage=true \
  /p:CoverletOutputFormat=cobertura \
  /p:CoverletOutput=./TestResults/Coverage/
If the command fails, try running it like this:
-
MSYS2_ARG_CONV_EXCL="*" dotnet test --no-build \
  --configuration Release \
  /p:CollectCoverage=true \
  /p:CoverletOutputFormat=cobertura \
  /p:CoverletOutput=./TestResults/Coverage/
This command resembles the one you ran previously. The
/p:flags tell coverlet which code coverage format to use and where to place the results.
6. Run the following dotnet tool run command to use ReportGenerator to convert the Cobertura file to HTML:
dotnet tool run reportgenerator \
  -reports:./Tailspin.SpaceGame.Web.Tests/TestResults/Coverage/coverage.cobertura.xml \
  -targetdir:./CodeCoverage \
  -reporttypes:HtmlInline_AzurePipelines
A number of HTML files appear in the CodeCoverage folder at the root of the project.
- In Visual Studio Code, expand the CodeCoverage folder, right-click index.htm, and then select Reveal in Explorer (Reveal in Finder on macOS or Open Containing Folder on Linux).
- In Windows Explorer (Finder on macOS), double-click index.htm to open it in a web browser.You see the coverage report summary.
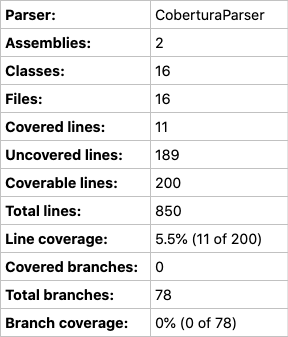
- Scroll to the bottom of the page to see a coverage breakdown by class type.
- Select the link to
TailSpin.SpaceGame.Web.LocalDocumentDBRepository`1to view further details.Notice that theGetItemsAsyncmethod is covered by unit tests, but theCountItemsAsyncmethod has no coverage.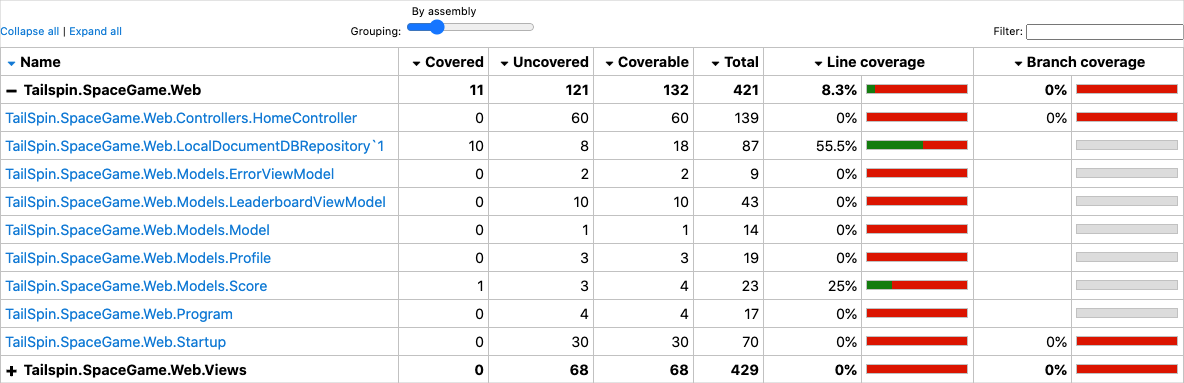 This makes sense, because the
 FetchOnlyRequestedGameRegiontest method calls theGetItemsAsyncmethod but does not call theCountItemsAsyncmethod. (To review the test code, see the DocumentDBRepository_GetItemsAsyncShould.cs file.)
Create a branch
Now that you can build a code coverage report locally, you’re ready to add tasks to your build best cheap web hosting pipeline, which performs the same tasks.
In this part, you create a branch named code-coverage, based on the unit-tests branch, to hold your work. In practice, you would ordinarily create this branch from the master branch.
- In Visual Studio Code, open the integrated terminal.
- In the terminal, run the following
git checkoutcommand to create a branch namedcode-coverage:
git checkout -b code-coverage
Commit your changes and push the branch to GitHub
Here you push your changes to GitHub and see the pipeline run. Recall that you’re currently in the code-coverage branch.
Although not required, here you add and commit each file separately so that each change is associated with a descriptive commit message.
- In Visual Studio Code, go to the terminal.
- Add and commit the Tailspin.SpaceGame.Web.Tests.csproj file, which now contains a reference to the
coverlet.msbuildpackage:Bash
-
git add Tailspin.SpaceGame.Web.Tests/Tailspin.SpaceGame.Web.Tests.csproj git commit -m "Add coverlet.msbuild package" - Add and commit the tool manifest file, dotnet-tools.json:
-
git add .config/dotnet-tools.json git commit -m "Add code coverage" - Add and commit azure-pipelines.yml, which contains your updated build configuration:
-
git add azure-pipelines.yml git commit -m "Add code coverage" - Push the
code-coveragebranch to GitHub.
-
git push origin code-coverage
Watch Azure Pipelines run the tests
Here you see the tests run in the pipeline and then visualize the results from Azure Test Plans.
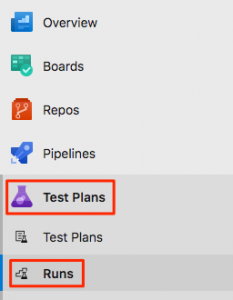
- In Azure Pipelines, trace the build through each of the steps.
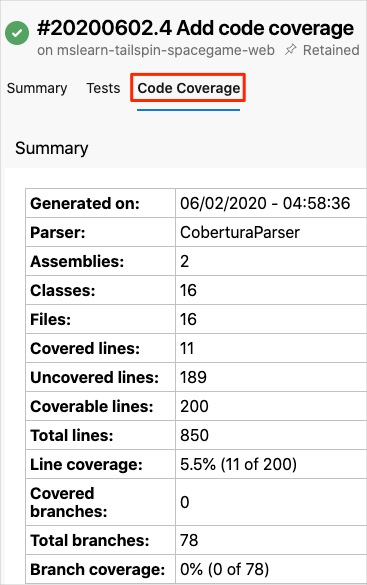
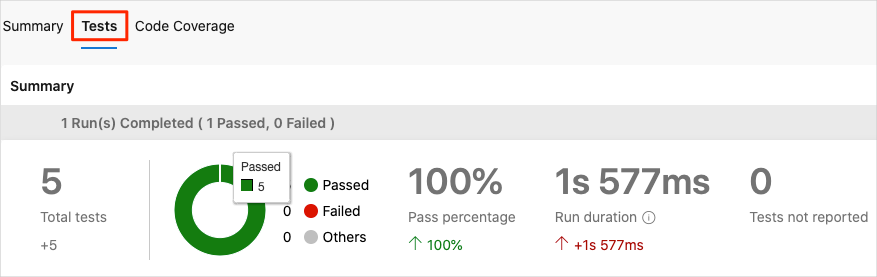
- When the build finishes, navigate back to the summary page and select the Code Coverage tab.You view the same results that you did when you ran the tests locally.
As an optional step, you can explore the results from Azure Pipelines.
Add the dashboard widget
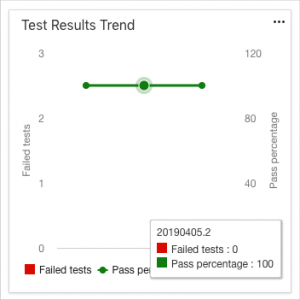
In the previous part, you added the Test Results Trend widget to your dashboard, which lets others quickly review test result trends over time.
Here you add a second widget that summarizes code coverage.
- In a new browser tab, go to marketplace.visualstudio.com .
- On the Azure DevOps tab, search for code coverage.
- Select Code Coverage Widgets (published by Shane Davis).
- Select Get it free.
- In the drop-down list, select your Azure DevOps organization.
- Select Install.
- Go back to Azure DevOps.
- Go to Overview > Dashboards.
- Select Edit.
- Search for Code Coverage, and then select Code Coverage.
- Drag Code Coverage to the canvas.
- Select the gear icon to configure the widget.
- Keep all the default settings, except for:
- Width: Enter 2.
- Build definition: Select your pipeline.
- Coverage measurement: Enter Lines.
- Select Save.
- Select Done Editing.
The widget shows the percentage of code your unit tests cover.
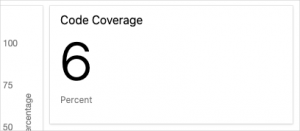
You now have code coverage set up in your pipeline. Although your existing code coverage is low, you have a baseline that you can improve over time.
Later, you can configure coverlet to check to see whether your tests provide a minimum threshold of coverage. Your threshold might be 30 percent, 50 percent, or 80 percent coverage, depending on your requirements. The build will fail if less than this amount is covered by your tests.
Remove code coverage files
Recall that when you ran Reportgenerator earlier, a number of HTML files appeared in the CodeCoverage folder at the root of the project.
These HTML files are not intended to be included in source control, and you no longer need them. Although the project’s .gitignore file is already set up to ignore anything in the CodeCoverage directory, it’s a good idea to delete these files so that they’re not added to your Git repository in future modules.
 You see the most recent test runs, including the one you just ran.
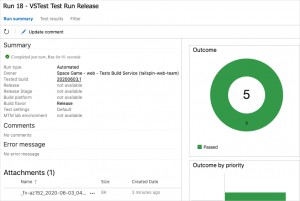 In this example, all five tests have passed. If any tests failed, you could navigate to the build task to get additional details.